This news follows the Federal Energy Regulatory Commission’s passing
Order 755
which relates to payments made for controlling the security of the electricity
market.
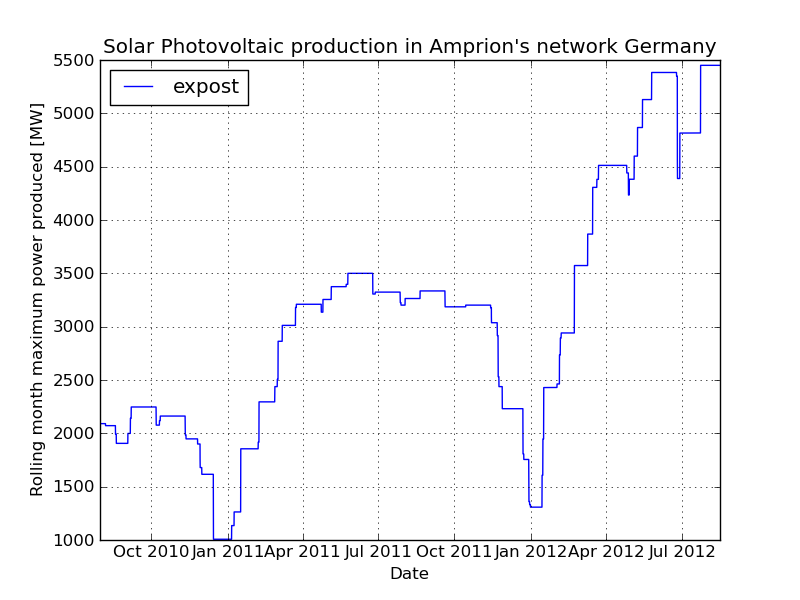
Peak solar output increases over a two year period [Larger Size]
We found in a recent survey that peak solar power production in Amprion’s network
has more than doubled since 2010.
An attractive investment
Sizeable increases have been attributed to the attractive feed-in tariff scheme set
up by the German government.
The German solar industry is supported by feed in tariffs paid to solar
energy producers. Solar farm owners of less than 10MW in size are paid
handsomely for every kWh of energy they produce.
[..] I have a fancy now: to have applications like this one [...] available for members interested
the 44th CIGRE Paris has 444 paper presentations
At the 44th CIGRE Paris
this year, there are over 6000 engineers attending to see 444 paper
presentations held in 4 rooms concurrently.
But CIGRE isn’t just about the presentations, its a time to duck out mid-
session and take your loved one for a coffee, a time to meet with someone just
like you that works in the same job in another country.
Previously I
mentioned that the Australian electricity prices have gone through the roof
(more than doubling) since the introduction of the carbon tax.
If you are an electrical engineer, and want to know how to use Python
to get data from the Internet and display it, this post is for you.
(This is the third part of a four part series. By the end we’ll have written a Python
script to display a chart of electricity market prices.
Enter your email → on the right so that you don’t miss the final post.)
Previously I
mentioned that the Australian electricity prices have gone through the roof
(more than doubling) since the introduction of the carbon tax.
We’re using these high prices as an excuse to learn how to download and
display price data from the internet. This code will work wherever you are in
the world.
Using Python to extract a zipped file
Last time, we downloaded a zipped file filled with electricity prices from the
energy market operator’s website (read about it here if you want to catch up). Here is the final code from that post:
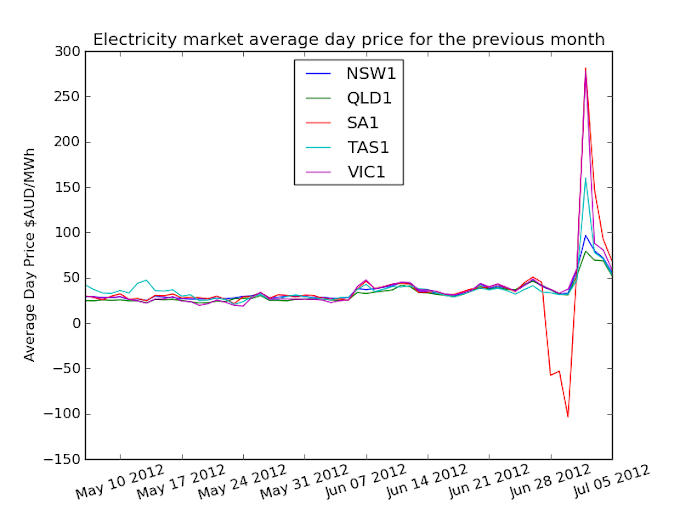
Since the carbon tax was introduced in Australia, the spot price for
electricity has been very high. From $22 / MWh last month to over $50
/ MWh so far (see the chart below). Whether this is a long term change, or
just a temporary reaction, we don’t know. Instead of considering the
complexities of market forces, we’re going to show you step by step exactly
how to build your own Python program to display electricity prices, using
Australia as an example.
Graphics, when used correctly, can be the difference between an outstanding
report and simply another piece of paper going around the office. The only
thing more professional than a nice graphic, is a graphic that is
automatically generated.
Exporting plots from the PSSE graphical interface can be a laborious task,
with little flexibility in the final result. If you are running PSSE from Python, you have the option of looking beyond PSSE for
tools to render your data.
Sri Lanka's demand for electricity is growing quickly
Sri Lanka’s peak electricity demand of 2000 MW is growing at a rapid 5%-8%
every year.
To keep pace with the increase, the Ceylon
Electricity Board (CEB) have developed a clever plan. Over the next 10
years, over 400 MW of mini hydro and wind farms will be installed. It is
anticipated the additional generation will meet the increased demand levels
and reduce Sri Lanka’s dependance on foreign fossil fuel sources, such as
coal, natural gas and petroleum.